Posts

Showing posts with the label Bureau of Labor Statistics

Machining Demand Surges With Boom in U.S. Manufacturing

Image
From ThomasNet This week’s Thomas Index will be taking a look at sourcing activity for Precision Machining by users in the Thomas Network at Thomasnet.com. Precision Machining is a process in which a machine operator starts with a piece of material called a blank, which is typically metal and uses the machine for precise, controlled removal of materials to transform that blank into a finished product. Machining encompasses a number of different manufacturing processes such as milling, turning, drilling, and tapping. It’s high-tech stuff; computer numerical control, or “CNC” machining involves computer programming and electromechanical devices for ultra-precise positioning of machining tools, to create incredibly complex surfaces and intricate geometries.

Labor force participation rates projected to decline over next decade

Image
From Bureau of Labor Statistics : After reaching its historical peak at 67.1 percent in 2000, the labor force participation rate for all workers (age 16 and over) is projected to decline to 61.0 percent in 2026. The decline in the rate is largely the result of the aging population, as more and more workers move into higher age groups that tend to have lower participation rates. The overall labor force participation rate has been declining since 2000, dropping sharply following the 2007–09 recession and reaching 62.8 percent in 2016. The continued shift of the population into older age groups will have long-lasting effects on the labor force and the overall labor force participation rate. In 1996, the entire baby-boom generation was in the 25-to-54-year-old group, with a labor force participation rate of 83.8 percent. In 2001, the first of the baby boomers moved into the 55-and-older age group. Although the 25-to-54-year-old group shows the strongest attachment to the labor mark...

The cost of care: new insights into healthcare spending growth

Image
From the Bureau of Labor Statistics : The Bureau of Labor Statistics (BLS) is celebrating the first anniversary of experimental disease-based price indexes, which adjust expenditures on diseases for inflation. Statistical agencies have long collected price information on medical procedures, drugs, equipment, and services, but the cost of treating a patient is typically some combination of these goods and services. Many users of the Federal Statistical System have asked that medical care spending be reported on a disease basis.1 Creating price indexes on a disease basis helps provide a greater understanding of the cost of care for a given condition... Why report prices on a disease basis? Although health care statistics that are generated on a goods and services basis (i.e., hospitals and doctor visits) are important, we can learn more information if we add statistics on a disease basis. To get the fullest understanding of our healthcare economy, we need both sets of indexes. User...

Households spent an average of $528 on pets in 2015

Image
From the Bureau of Labor Statistics In 2015, households spent an average of $528 on pets, or about 1 percent of average household spending. Pet expenditures include pet food; pet purchases, supplies, and medicine; pet services; and veterinary services. Average household spending on pet food jumped from $190 in 2014 to $230 in 2015, or from 37 percent of average household spending on pets to 44 percent. Average household spending on veterinary services, which reached over $200 in 2008, was $133 in 2015, or about 25 percent of average household expenditures on pets. Average household spending on pet purchases, supplies, and medicine, which represented 34 percent of average household spending on pets in 2010, measured only 22 percent of pet expenditures in 2015, falling from $163 to $116 over that period. On average, households with one consumer spent the least on pet expenditures in 2015 ($360), while households with two consumers spent the most ($672). Average household spending ...

4,836 fatal work injuries in the United States during 2015

Image
From the Bureau of Labor Statistics A total of 4,836 fatal work injuries were recorded in the United States in 2015, a slight increase from the 4,821 fatal injuries reported in 2014. There were 2,054 fatal work injuries involving transportation incidents, an increase from the previous year. Within the transportation category, roadway incidents increased in 2015. Roadway incidents accounted for 26 percent of all fatal work injuries. Almost half of these fatalities involved some kind of tractor-trailer truck. Fatal injuries involving pedestrians were lower in 2015, as were rail and water vehicle incidents. There were 800 work fatalities due to falls, slips or trips in 2015. Falls to a lower level accounted for 81 percent of all fatal falls.

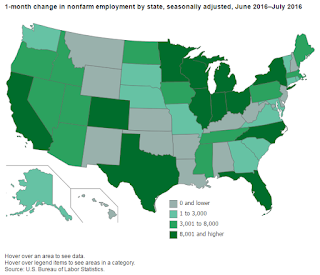
New York added 37,500 jobs in July 2016

Image
From the Bureau of Labor Statistics : In July 2016, 15 states had statistically significant over-the-month increases in nonfarm payroll employment in July 2016. The largest job gains occurred in New York (+37,500), California (+36,400), and Florida (+28,100). In percentage terms, the largest increases occurred in North Dakota and Vermont (+1.0 percent each), followed by Maine (+0.7 percent). The only significant decrease in employment over the month occurred in Kansas (-5,600, or -0.4 percent). In July, 36 states had statistically significant over-the-year changes in nonfarm payroll employment, 34 of which were increases. The largest job gains occurred in California (+374,600), Florida (+250,200), and Texas (+173,000). The largest percentage gain occurred in Idaho (+3.4 percent), followed by Oregon (+3.3 percent) and Florida and Utah (+3.1 percent each). Two states had significant over-the-year declines in employment: North Dakota (-9,900, or -2.2 percent) and Wyoming (-9,800, or -...

The high-tech industry, what is it and why it matters to our economic future

Image
From the Bureau of Labor Statistics High-tech industries are an important part of the U.S. economy, employing nearly 17 million workers in 2014. While this accounted for about 12 percent of total employment, the high-tech sector contributed almost 23 percent of output. According to a study funded by the Workforce Information Council, the high-tech sector can be defined as industries having high concentrations of workers in STEM (Science, Technology, Engineering, and Mathematics) occupations. Although the term high-tech has been notoriously difficult to define, as technology changes all the time, this analysis provides an approach to defining jobs that are in in this sector. This issue of Beyond the Numbers applies the approach used by WIC to Bureau of Labor Statistics (BLS) data on industry employment and output. It provides an overview of which industries make up the high-tech sector and analyzes historical and projected industry employment and output data from the BLS Employment ...

Employee benefits, industries and occupations, and worker safety & health since 1980

Image
From the Bureau of Labor Statistics : The Bureau of Labor Statistics (BLS) initiated the annual Employee Benefits Survey (EBS) in 1979, covering medium-size and large private sector establishments. Respondents to the survey provide data on the coverage and provisions that their plans offer employees, and BLS analyzes the data and publishes statistics on those plans in, among other places, the Review. Data from the EBS began coming in and, together with data from other sources, informed the Review’s pages throughout the 1980s. In 1915, when Commissioner Royal Meeker established the Monthly Review, the stated purpose of the new publication was to publish “the results of original investigations...[and] notices of labor legislation,” with attention paid to “the current work of this bureau [BLS], the other bureaus of the Department of Labor, or any other Government agencies dealing directly with labor matters.” In addition, the Review would “report [on] industrial accidents and occupat...

Which industries need workers? Exploring differences in labor market activity

Image
Interesting new information from the Bureau of Labor Statistics Where should new graduates look for jobs? What about career changers? In what direction should career counselors and job placement programs direct clients? Which statistics can government officials use to help determine how to stimulate job growth? How do employers know if their turnover and worker demands are typical? Industries differ in employee turnover patterns, demand for workers, and ability to hire the workers they need. Understanding the labor turnover characteristics of the different industries may help jobseekers, those assisting them, employers, and government officials better focus their efforts. Each data element in the Job Openings and Labor Turnover Survey (JOLTS)—job openings, hires, and separations—provides information about the labor market. However, when all three data elements are studied together, an even more informative picture emerges. The job openings data tell us about the unmet demand for wor...

The de-licensing of occupations in the United States

From the Bureau of Labor Statistics Occupational licensing directly affects nearly 30 percent of U.S. workers today and continues to grow in density and scope. In this article, we identify and analyze those rare instances when occupational licensing laws have been eliminated—what we refer to as “de-licensing.” We also discuss recent examples in which courts decided to limit the scope of occupational licensing laws, and we analyze recent efforts (almost uniformly unsuccessful) of a few states to de-license groups of occupations. The reason proposed for most of these efforts is that excessive levels of licensing have hindered job creation, especially for people with lower levels of education. We argue that the paucity of successful de-licensing efforts is due to intense lobbying by associations of licensed professionals as well as the high costs of sunset reviews by state agencies charged with the periodic review of licensing and its possible termination.

Employment of veterans by occupation, 2014

Among employed veterans age 18 or older, the most common occupations for men are professional and related; management, business, and financial operations; and service occupations. In 2014, these three groups accounted for 50 percent of all employed men who had previously served on active duty in the U.S. Armed Forces. These were also the largest occupational groups among male nonveterans. Male veterans were more likely than nonveterans to work in transportation and material moving and installation, maintenance, and repair occupations. Male veterans were less likely to work in construction occupations. Female veterans were most likely to work in professional and related; office and administrative support; and management, business, and financial operations occupations. Seventy percent of women who were veterans worked in these occupations. Nonveteran women were less likely to work in these occupations. Female veterans were more likely than nonveterans to work in professional and relate...

Fatal occupational injuries by day of week and month, 1992–2011

During the 20-year period from 1992 to 2011, the majority (83 percent) of all fatal occupational injuries occurred during the traditional workweek, Monday through Friday. A total of 80,645 workers were fatally injured during the day (7 a.m. to 6:59 p.m.) from 1992 to 2011. Another 26,631 were fatally injured during the night and evening hours (7 p.m. to 6:59 a.m.). For 7,815 cases, time of incident was unknown. From 1992 to 2011, July had the highest number of fatal occupational injuries (11,168), and the fewest number of injuries occurred in February (8,008). Just over a quarter of workers (28 percent, or 32,795) were fatally injured during the summer months of June, July, and August. In comparison, the winter months of December, January, and February totaled 25,380 fatal injuries (22 percent). Bureau of Labor Statistics

Wages of retail salespersons, by state; explore employment and wage data for more than 800 occupations

In May 2013, almost 4.5 million people in the United States were employed as retail salespersons. Nationally, retail salespersons earned an annual mean wage of $25,370. The annual median wage for retail salespersons was $21,140. Among the states, retail salespersons in Washington had the highest annual mean wage of $28,920. Alaska had the highest annual median wage for retail salespersons, at $24,030. On average, retail salespersons in West Virginia earned the least in May 2013, at $22,920. The median wage for retail salespersons in West Virginia was $19,450. These data come from the Occupational Employment Statistics program . For maps exploring employment and wage data for more than 800 occupations, see the OES interactive map changer tool. A percentile wage divides the workers in an occupation into two groups: those earning less, and those earning more. For example, a 10th percentile wage indicates that 10 percent of workers earn less than the stated amount, and 90 percent earn ...

The Employment Situation – November 2014

The number of persons employed part time for economic reasons (sometimes referred to as involuntary part-time workers), at 6.9 million, changed little in November. These individuals, who would have preferred full-time employment, were working part time because their hours had been cut back or because they were unable to find a full-time job. In November, 2.1 million persons were marginally attached to the labor force, essentially unchanged from a year earlier. (The data are not seasonally adjusted.) These individuals were not in the labor force, wanted and were available for work, and had looked for a job sometime in the prior 12 months. They were not counted as unemployed because they had not searched for work in the 4 weeks preceding the survey. Among the marginally attached, there were 698,000 discouraged workers in November, little different from a year earlier. (The data are not seasonally adjusted.) Discouraged workers are persons not currently looking for work because they ...

Median weekly earnings, 2004–2014

Median weekly earnings of the nation’s 106.9 million full-time wage and salary workers were $797 (seasonally adjusted) in the third quarter of 2014. Women who usually worked full time had median weekly earnings of $722, or 82 percent of the $880 median for men. After adjusting for inflation in consumer prices, women's earnings have changed little over the past decade and men's earnings have declined slightly. More from the Bureau of Labor Statistics

Keeping Up With Labor Market Changes: The Bureau of Labor Statistics

Everyone deserves the opportunity to have an occupation that provides a decent standard of living. Increasingly, earning a middle class income requires that workers have a post-secondary credential and regularly upgrade their skills. The recession accelerated this occupational transformation.  For the nation’s economic well-being, workers and their communities need to adjust to the new realities of the labor market. However, evidence suggests a growing mismatch between worker capabilities and employer needs. Left unchecked, this gap will impair the economic health of the nation and its workforce. To address this issue, U.S. labor markets require access to current, accurate, detailed statistics. Labor market participants—individuals, educators, and employers—and policymakers at all levels of government need good data to make informed choices about, for example, career paths, training programs, hiring, and public investments. At present, however, labor market participants and po...

Older workers less likely to have severe work injuries, but they miss more work days to recover

From the Bureau of Labor Statistics : The rate of nonfatal occupational injuries and illnesses requiring days away from work to recuperate was 112 cases per 10,000 full-time workers in 2012, down from 117 cases in 2011. The median days away from work—a key measure of severity of injuries and illnesses—was 9 days in 2012. Workers age 65 and older had the lowest incidence rate in 2012 at 89 cases per 10,000 full-time workers, but they required the longest time away from work to recover, a median of 14 days.

Employment Projections: 2012 - 2022

Occupations and industries related to healthcare are projected to add the most new jobs between 2012 and 2022, the U.S. Bureau of Labor Statistics (BLS) reported. Total employment is projected to increase 10.8 percent, or 15.6 million, during the decade. In addition to projecting employment for each detailed occupation, BLS depicts the education, related work experience, and on-the-job training typically needed for occupations. Occupations that typically require postsecondary education for entry are expected, on average, to grow faster than occupations that require a high school diploma or less. This news release [PDF] focuses on several areas of projections data: labor force and the aggregate economy, industry employment, occupation employment, education and training, and replacement needs.

Advance GDP by Industry Statistics for 2012

From the Bureau of Labor Statistics : Durable-goods manufacturing, finance and insurance, and wholesale trade were the leading contributors to U.S. economic growth in 2012, according to advance statistics on the breakout of real gross domestic product (GDP) by industry from the Bureau of Economic Analysis. Overall, 19 of 22 industry groups contributed to the 2.2 percent increase in real GDP. Manufacturing real value added—a measure of an industry’s contribution to GDP—rose 6.2 percent in 2012, after increasing 2.5 percent in 2011. Durable-goods manufacturing, the largest contributor to overall growth in the economy for the third consecutive year, increased 9.1 percent, after increasing 6.8 percent in 2011 and 13.3 percent in 2010. The finance and insurance industry group increased 3.6 percent in 2012, after two consecutive years of negative real value added growth. Wholesale trade increased 4.8 percent, after increasing 3.0 percent in 2011.

Workplace Injuries and Illnesses – 2011

From the Bureau of Labor Statistics - Nearly 3.0 million nonfatal workplace injuries and illnesses were reported by private industry employers in 2011, resulting in an incidence rate of 3.5 cases per 100 equivalent full-time workers, according to estimates from the Survey of Occupational Injuries and Illnesses (SOII) conducted by the U.S. Bureau of Labor Statistics. The rate reported for 2011 was unchanged for the first time in a decade during which the total recordable cases (TRC) injury and illness incidence rate among private industry employers declined significantly each year since 2002, when estimates from the SOII were first published using the current OSHA requirements for recording occupational injuries and illnesses. The incidence rate of injury and illness cases involving job transfer or restriction only among private industry establishments declined in 2011. Rates remained unchanged from 2010 for all other case types—cases with days away from work, job transfer, or rest...