Posts

Showing posts with the label Census

New York Population FactFinder

Image
From FactFinder : NYC Department of City Planning’s Population Division is proud to announce the release of New York City Population FactFinder (NYC PFF), a major update of NYC Census FactFinder (CFF). The application has been developed at City Planning by its extraordinary Labs Team, and they are excited to finally share it with you! The latest iteration includes a host of improvements that the user base has requested, including: Intuitive design that allows you to easily define study areas Enhanced interactive map and expanded geographic options for creating custom study areas by combining census blocks, tracts, neighborhoods (NTAs), or Community Districts (PUMAs) Expanded profile content, including population density; and detailed languages, countries of birth, and disability status Indicators of reliability and statistical significance for all estimates, so you can be confident using the data Change over time and detailed comparisons of two areas Ability to save and share un

Economic Census End Date Approaching

Image
Obtained From:   US Census Bureau With only a few weeks left for your business to submit their census survey to the United States Census Bureau (USCB), the deadline is fast approaching. This year the USCB will be conducting the surveys online for the first in its history, which it hopes will streamline the process and make it easier for them to consolidate and itemize the data. Below is a brief list of just why  the economic census is important and what they use the information for: What is the Economic Census?  Every five years, the U.S. Census Bureau conducts the Economic Census, the official measure of the Nation’s businesses and economy. Businesses, policymakers, governments and communities use Economic Census data for economic development, business decisions, and strategic planning. The Economic Census serves as the statistical benchmark for current economic activity such as the Gross Domestic Product and the Producer Price Index. It provides information on business

Economic Census Response

Image
Obtained From:  US Economic Census Response for the Economic Census begins on    May 1, 2018 and is available for the following month, up until June 12, 2018 . The data businesses provide is compiled into official statistics that are available for companies to use for planning and decision making. The Economic Census asks for the following information by location:      1. Employer Identification Number      2. Physical Location      3. Primary Business Activity      4. Sales, receipts, or revenue      5. Employment and payroll      6. Industry-specific questions Here is some information to help businesses navigate the Census: How do I get started?  To begin, link yourself to your survey. You link your account to your survey by an authentication code sent to you from the Census Bureau. Once you have this code, click on the “Add Authentication Code” button under “My Surveys.” Enter and submit your unique 12-digit code. After submitting your authentication code, a surve

First-Ever Online Economic Census

Image
Obtained From:  United States Census About The Survey The Economic Census is the U.S. Government's official five-year measure of American business and the economy. It is conducted by the U.S. Census Bureau, and response is required by law. Starting with the 2017 Economic Census, response will be entirely paperless. The Economic Census will mail out information on how to access the electronic instrument in May 2018 to the nearly 4 million businesses, including large, medium, and small companies representing all U.S. and Island Area locations and industries. Respondents will be asked to provide a range of operational and performance data for their companies. Respondent Materials To help you prepare for online reporting, click on the link below and then the appropriate survey questions and instructions (if applicable). (All surveys are in Adobe PDF file format and are for informational purposes only) Preview Survey Questions and Instructions https://bhs.econ.census.gov/o

Startup Firms Created Over 2 Million Jobs in 2015

Image
From the US Census Bureau:  In 2015, the nation’s 414,000 startup firms created 2.5 million new jobs according to data from the Census Bureau’s  Business Dynamics Statistics . In contrast, this level of startup activity is well below the pre-Great Recession average of 524,000 startup firms and 3.3 million new jobs per year for the period 2002-2006. Other highlights include: ·   Job creation in the United States totaled 16.8 million with job destruction equaling 13.7 million. Job creation minus job destruction equaled net job creation of 3.1 million in 2015. ·   Young firms (those less than 6 years old) accounted for 11 percent of employment and 27 percent of job creation. ·   Old firms (those more than 25 years old) comprised 62 percent of employment and 48 percent of job creation. ·   The job creation rate for young firms, excluding startups, was 20 percent in 2015. This rate is above the Great Recession low of 15 percent in 2009, and it has recovered to its average level of 20 perce

Data For Your Business: new Census Business Builder

Image
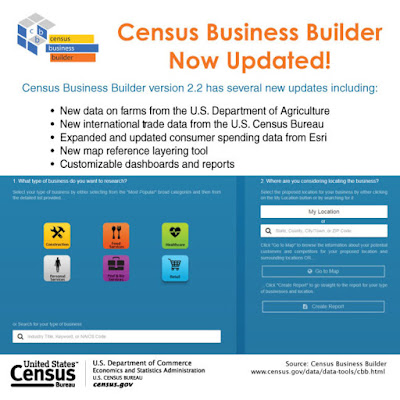
The Census Business Builder (CBB) is a suite of services that provide selected demographic and economic data from the U.S. Census Bureau tailored to specific types of users in a simple to access and use format. The Census Bureau is pleased to announce that the new edition of Census Business Builder is now live! This new edition of Census Business Builder allows you to: Add a Reference Layer from a Gallery or from your own ShapeFile or Map Service Upload your own data via Excel Access Agricultural data from the USDA Access International Trade data from the Census Bureau Use the new Census Business Builder to get the data you need to start or grow your business. Check out the new features!

2015 Annual Retail Trade Survey

Image
From: The Census Bureau MARCH 6, 2017  — This  report  provides national estimates of total annual sales, e-commerce sales, end-of-year inventories, purchases, total operating expenses, inventories held outside the United States, gross margins, and end-of-year accounts receivable for retail businesses and annual sales, total operating expenses, and e-commerce sales for accommodation and food service firms located in the United States.   The  Annual Retail Trade Survey (ARTS)  sample covers employer businesses classified in retail trade sector and accommodation & food services sector located in the 50 states and the District of Columbia. The ARTS excludes data for businesses located in the U.S. territories. The data are published on a  North American Industry Classification System   basis and the estimates are used to benchmark the monthly retail sales and inventories estimates each spring. 

2015 Annual Retail Trade Survey

Image
This  report  provides national estimates of total annual sales, e-commerce sales, end-of-year inventories, purchases, total operating expenses, inventories held outside the United States, gross margins, and end-of-year accounts receivable for retail businesses and annual sales, total operating expenses, and e-commerce sales for accommodation and food service firms located in the United States. The  Annual Retail Trade Survey (ARTS)  sample covers employer businesses classified in retail trade sector and accommodation & food services sector located in the 50 states and the District of Columbia. The ARTS excludes data for businesses located in the U.S. territories. The data are published on a  North American Industry Classification System   basis and the estimates are used to benchmark the monthly retail sales and inventories estimates each spring.

Census Business Builder Updates

Image
The Census Bureau released updated editions of Census  Business  Builder that provide major updates and features, mobile-optimization, and performance improvements to this popular suite of tools.  Census  Business  Builder:  Small   Business  Edition  and  Census  Business  Builder: Regional Analyst Edition  include the following new features: ·         An expanded and customizable dashboard with charts that allow users to compare data at   national, state and local area levels and to compare current data to historical trends. ·         New map features, including the ability to download the data directly from the map. ·         Access to information at the state level as well as for counties, cities/towns, zip codes and census tracts. ·         New age category of 21 and older. ·         Fully interactive and downloadable reports. The  Small   Business  Edition also now includes industry access to all 2,014, 2- to 6-digit North American Industry Classification System   (NAICS) codes

324.3 million Americans, 7.36 billion in the world

Image
As our nation prepares to ring in the new year, the U.S. Census Bureau projected the U.S. population will be 324,310,011 on Jan. 1, 2017. This represents an increase of 2,245,347, or 0.70 percent, from New Year’s Day 2016. Since Census Day (April 1) 2010, the population has grown by 15,564,473, or 5.04 percent. In January 2017, the United States is expected to experience one birth every 8 seconds and one death every 11 seconds. Meanwhile, net international migration is expected to add one person to the U.S. population every 33 seconds. The combination of births, deaths and net international migration will increase the U.S. population by one person every 16 seconds. The projected world population on Jan. 1, 2017, is 7,362,350,168, an increase of 77,849,375, or 1.07 percent, from New Year’s Day 2016. During January 2017, 4.3 births and 1.8 deaths are expected worldwide every second. The Census Bureau’s U.S. and World Population Clock simulates real-time growth of the United States

The 2016 Holiday Season

This festive season, or simply the holidays, is a time for gathering and celebrating with family and friends, gift giving, reflection and thanks. To commemorate this time of year, the U.S.  Census  Bureau presents the following holiday-related facts and figures from its collection of statistics.           Rush to the Stores $23.8 billion The estimated retail sales by the nation’s department stores (including leased departments) in December 2015. A decrease of $0.4 billion in retail sales from December of the previous year.  Source: U.S.  Census  Bureau, Monthly Retail Trade Survey www. census .gov/econ/ currentdata/dbsearch?program= MRTS&startYear=2014&endYear= 2015&categories=4521I& dataType=SM&geoLevel=US& notAdjusted=1&submit=GET+DATA& releaseScheduleId Note: Leased departments are separately owned businesses operated as departments or concessions of other service establishments or of retail businesses, such as a separately ow

2013 Statistics of U.S. Businesses: Legal Form of Organization Tables

Data by legal form of organization, NAICS sector and enterprise employment size. Statistics include number of firms, number of establishments, employment and annual payroll.  Internet address: < http://www2.census.gov/econ/ susb/data/2013/us_naicssector_ lfo_2013.xlsx >

Where should you locate your business?

From BusinessUSA.gov: Wondering where to set up your new business, based on the amount of competition and consumer spending in that area, or other factors? The U.S. Census Bureau's Business Builder: Small Business Edition gives small business owners access to key demographic and economic data that can help when deciding on the location for a new business or expanding an existing one. Check out this blog for more on how it works.

2013 Statistics of U.S. Businesses

From the Census Bureau-  Data for metropolitan statistical areas and counties by enterprise employment size. Statistics include number of firms, establishments, employment and annual payroll.  2013  annual or static data include number of firms, number of establishments, employment, and annual payroll for most U.S. business establishments. The data are tabulated by geographic area, industry, and enterprise size. Industry classification is based on 2012 North American Industry Classification System  (NAICS)  codes. An establishment with 0 employment is an establishment with no paid employees in the mid-March pay period but with paid employees at some time during the year. Internet address: < http://www.census.gov/econ/ susb/ >.

2014 County Business Patterns data released

The U.S. Census Bureau has released the 2014 County Business Patterns (CBP) statistics on  Thursday, April 21, 2016 . CBP covers more than 7.5 million U.S. business establishments, and provides employment and payroll data at subnational levels by industry. For the first time ever, congressional district-level data has been released at the same time as CBP data. CBP data are obtained from Census Bureau reports and administrative records from other federal agencies. CBP defines employment as all full- and part-time employees who were on the payroll during the pay period that includes  March 12 .

Survey of Market Absorption 2015 Annual Report

The  2015 Survey of Market Absorption of New Multifamily Units annual report  provides absorption details for units constructed in 2014. The Survey of Market Absorption of New Multifamily Units is conducted by the U.S. Census Bureau on behalf of the Department of Housing and Urban Development. This survey measures how soon privately financed, nonsubsidized, unfurnished units in buildings with five or more units are rented or sold (absorbed) after completion. In addition, it collects data on characteristics such as number of bedrooms, asking rent and asking price.

2012 Survey of Business Owners released today

Nationally, today’s findings  of the 2012 Survey of Business Owners show the number of minority-owned firms in the U.S. rose from 5.8 million in 2007 to 8.0 million in 2012. This includes a 46.3 percent increase in the number of Hispanic-owned firms over the period, from 2.3 million to 3.3 million, and a 34.5 percent rise in the number of black or African American-owned firms, from 1.9 million to 2.6 million. Additionally, the number of Asian-owned firms climbed from 1.5 million to 1.9 million, an increase of 23.8 percent. For added context, total U.S. firms increased 2.0 percent during the same period, from 27.1 million in 2007 to 27.6 million in 2012. The 9.9 million women-owned firms in 2012 were up more than 2 million from five years earlier when there were 7.8 million women-owned businesses, a 26.8 percent increase. As a comparison, male-owned firms increased 6.8 percent from 13.9 million to 14.8 million during the same period. The Survey of Business Owners is a sample s

New Census Web Tool Helps Business Owners Make Data Driven Decisions

Image
New Census Web Tool Helps Business Owners Make Data Driven Decisions  The U.S. Census Bureau released  Census Business Builder: Small Business Edition , a new Web tool that allows business owners and entrepreneurs to easily navigate and use key demographic and economic data to help guide their research into opening a new business or adding to an existing one. The Census Business Builder was developed with user-centered design at its core and incorporated feedback from customers and stakeholders, including small business owners, trade associations and other government agencies. The tool combines data from the American Community Survey, the economic census, County Business Patterns and other economic surveys to provide a complete business profile of an area. Business statistics include the number of establishments, employment, payroll and sales. American Community Survey statistics include population characteristics, economic characteristics and housing characteristics.

Statistics of U.S. Businesses

2012  annual or static data include number of firms, number of establishments, employment, annual payroll, and estimated receipts for most U.S. business establishments. The data are tabulated by geographic area, industry, and enterprise size. Industry classification is based on 2012 North American Industry Classification System  (NAICS)  codes. An establishment with 0 employment is an establishment with no paid employees in the mid-March pay period but with paid employees at some time during the year. Receipts data are available only for economic census years (years ending in 2 and 7). View the latest receipts data below. Employment and Payroll Summary Report: 2012  [PDF, 1.1 MB] Data Tables by Enterprise Employment Size        The following links are subsets of SUSB data in spreadsheet format.        For more detailed industry and employment size classes, download additional data in  comma-delimited format.           U.S. and States:             U.S. & states, totals   [xls

What is the Business Expenses Program from the US Census?

The Business Expenses Survey (BES) was created originally to compile statistics on business operating expenses for Retail Trade, Wholesale Trade, and Service Industries. Expense data are key components of the Bureau of Economic Analysis (BEA) input-output (I-O) accounts, which are a critical element in the calculation of Gross Domestic Product (GDP).  Starting in 2003, the Service Annual Survey (SAS) began collecting selected expense items on their annual form. In 2004, Census and BEA formed a joint team, called the Core Expenses Group (CEG) to evaluate the collection of expense items across the many Census programs. The result of this team effort was a core set of expenses that have been collected on an annual basis since 2005 by the SAS and the Annual Survey of Manufacturers (ASM), and on a quinquennial basis by the Annual Retail Trade Survey (ARTS), Annual Wholesale Trade Survey (AWTS), and the Economic Census for Manufacturing, Construction, and Mining. What data is available